Store coming soon

Back to home
The Showcase

See the whole universe.

Four interactive guides, one design language. Systems to map the field, Radars to decode the tape, the free Crewmates to learn the chart — and the exclusive DS Carepack to finish every trade.

Each guide opens full-screen — press Esc or tap outside the header to return.

The Signature

Signature Ember candles, by DS Universe.

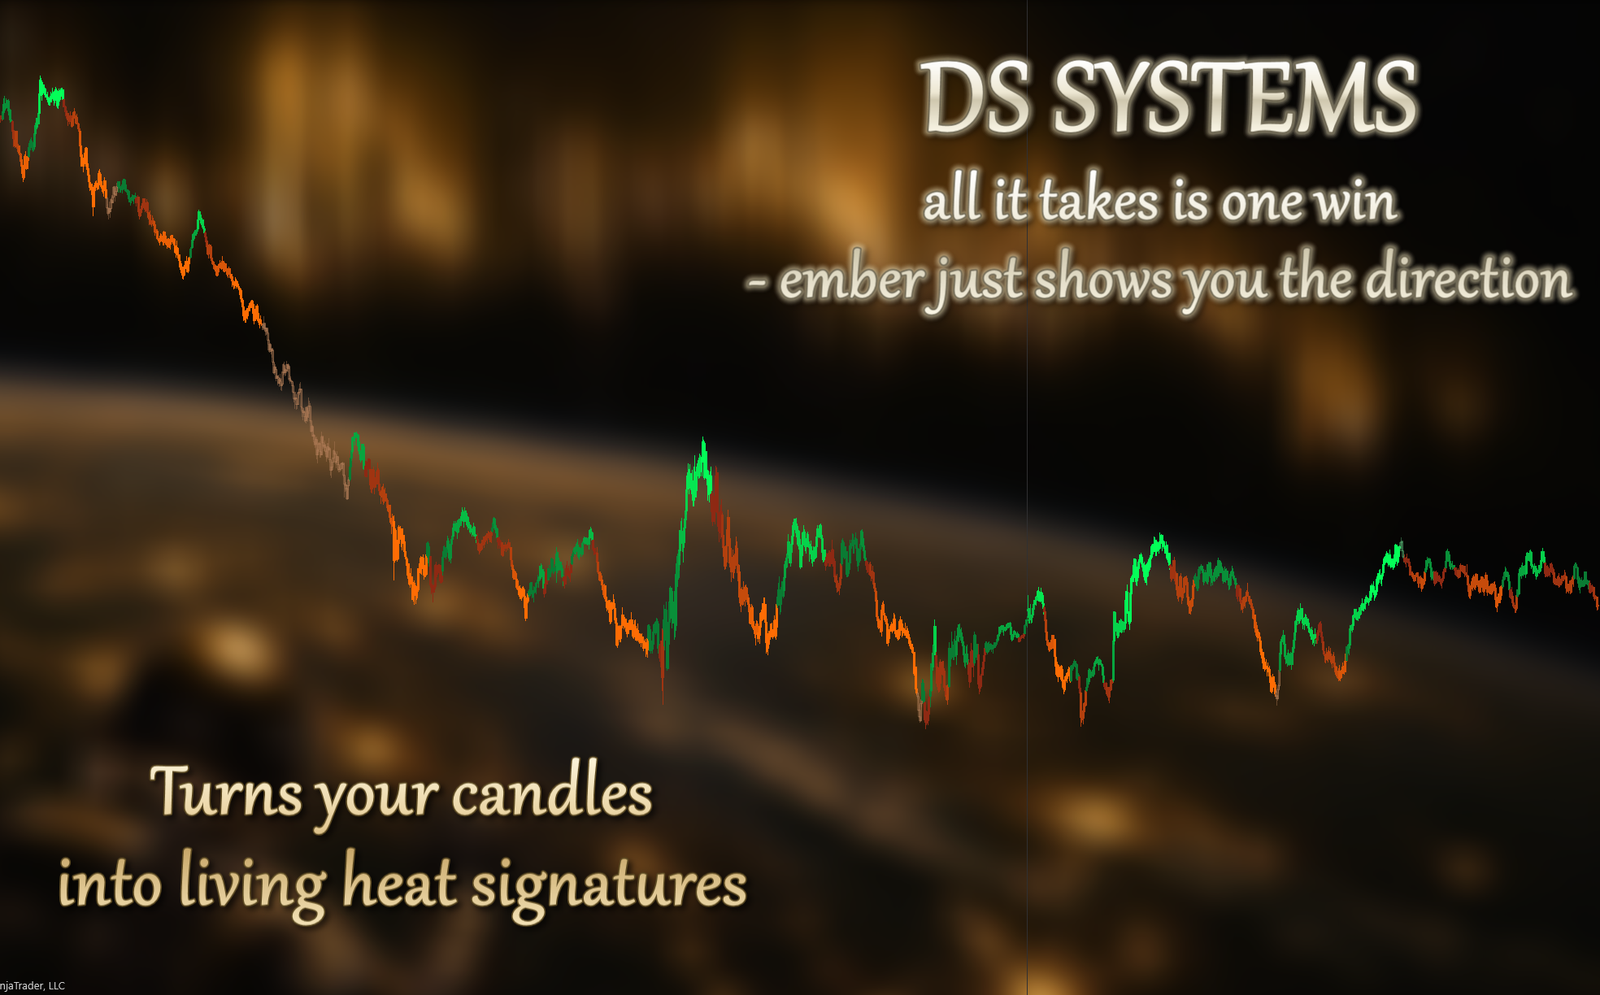
Ember reads the engine of the trend and re-colors every candle to match — burning bright and clean when a move has fuel, cooling to a smoky exhaust the moment it runs out. It feels the change before price itself does.

DS Ember turning candles into living heat signatures — every trend re-read live, zero repaints.
Ember in action. It calls exhaustion, recognizes the shift, and warns you the trend is cooling — early, on the candle, with zero repaints.
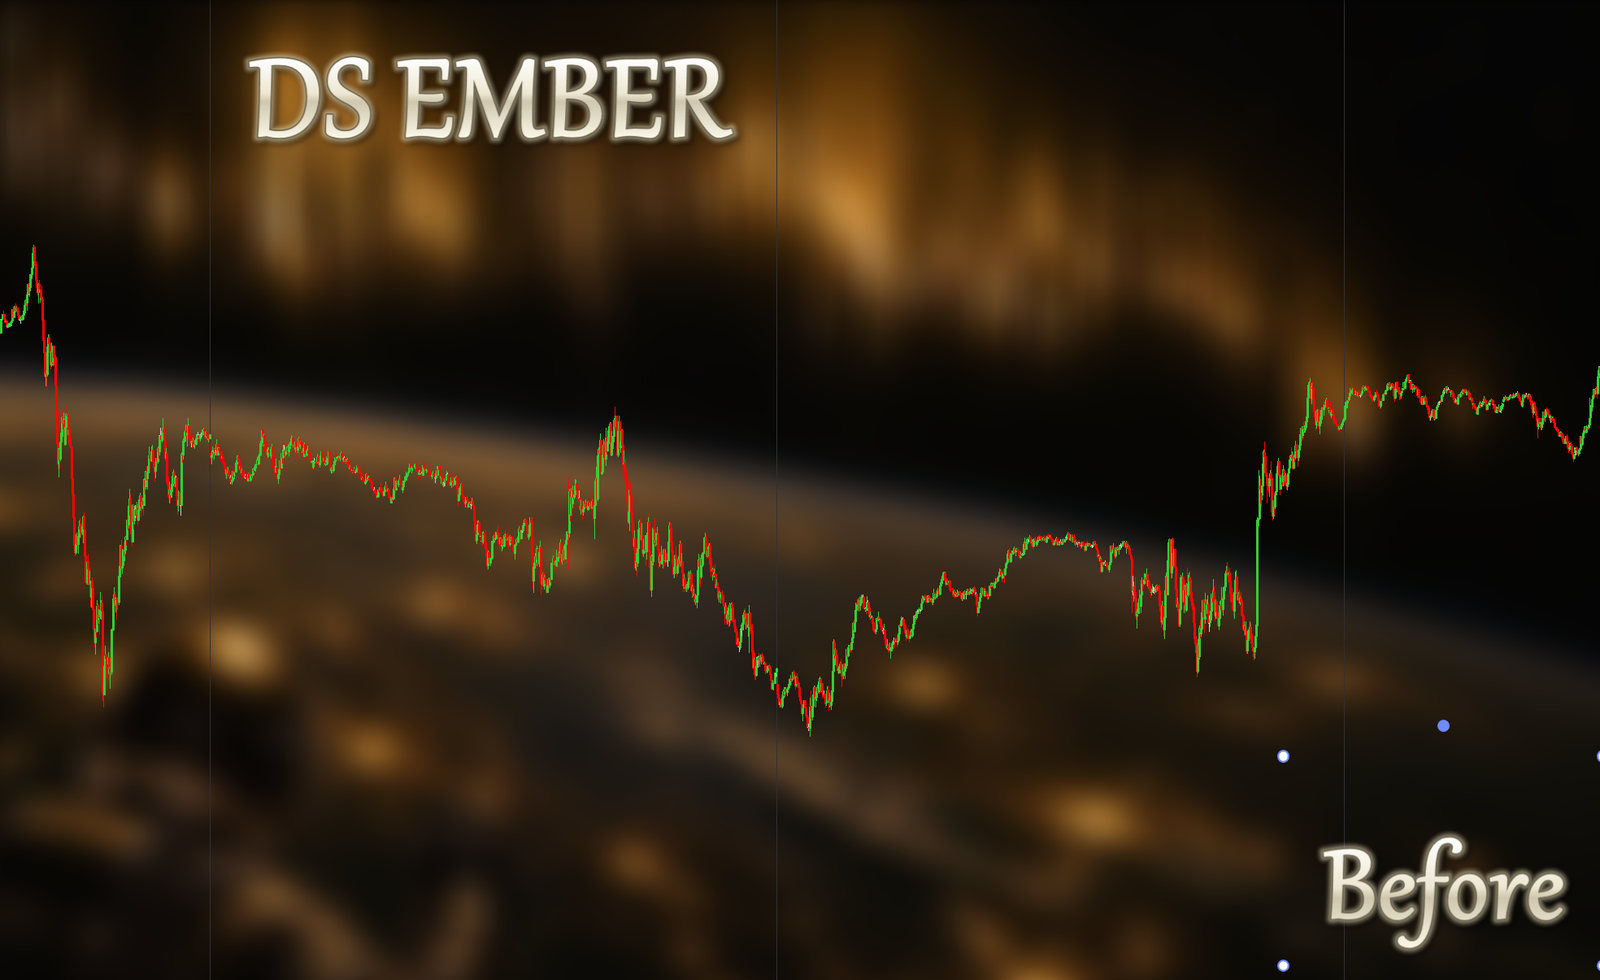
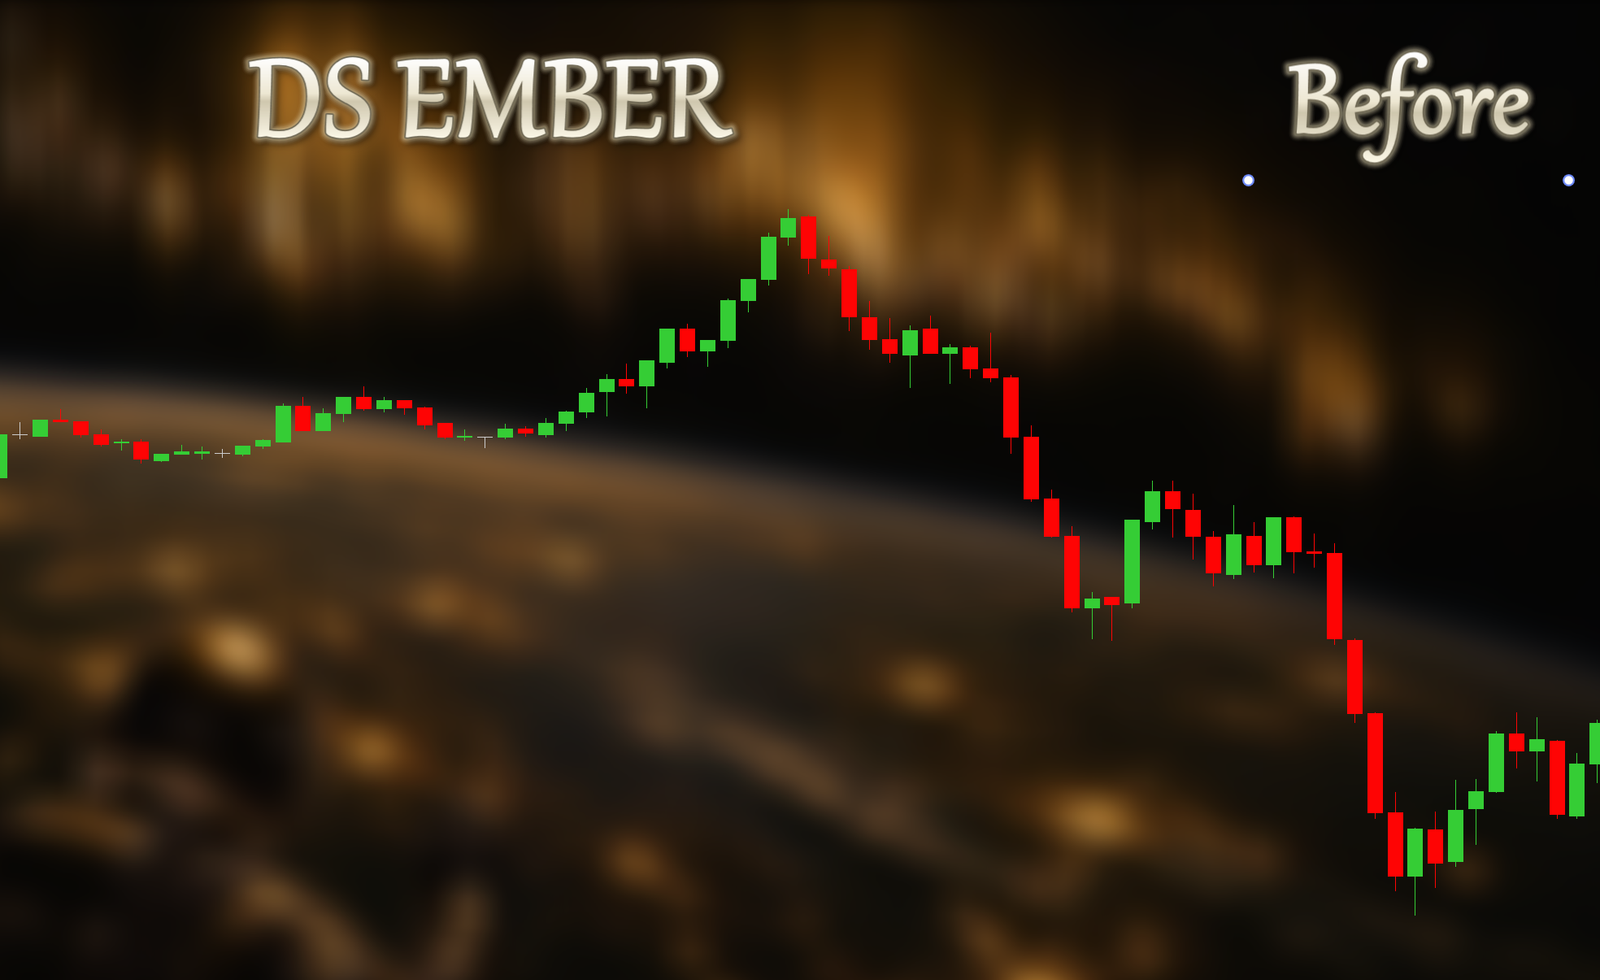
Raw candles flipping color on every small pullback through a trend.
Before
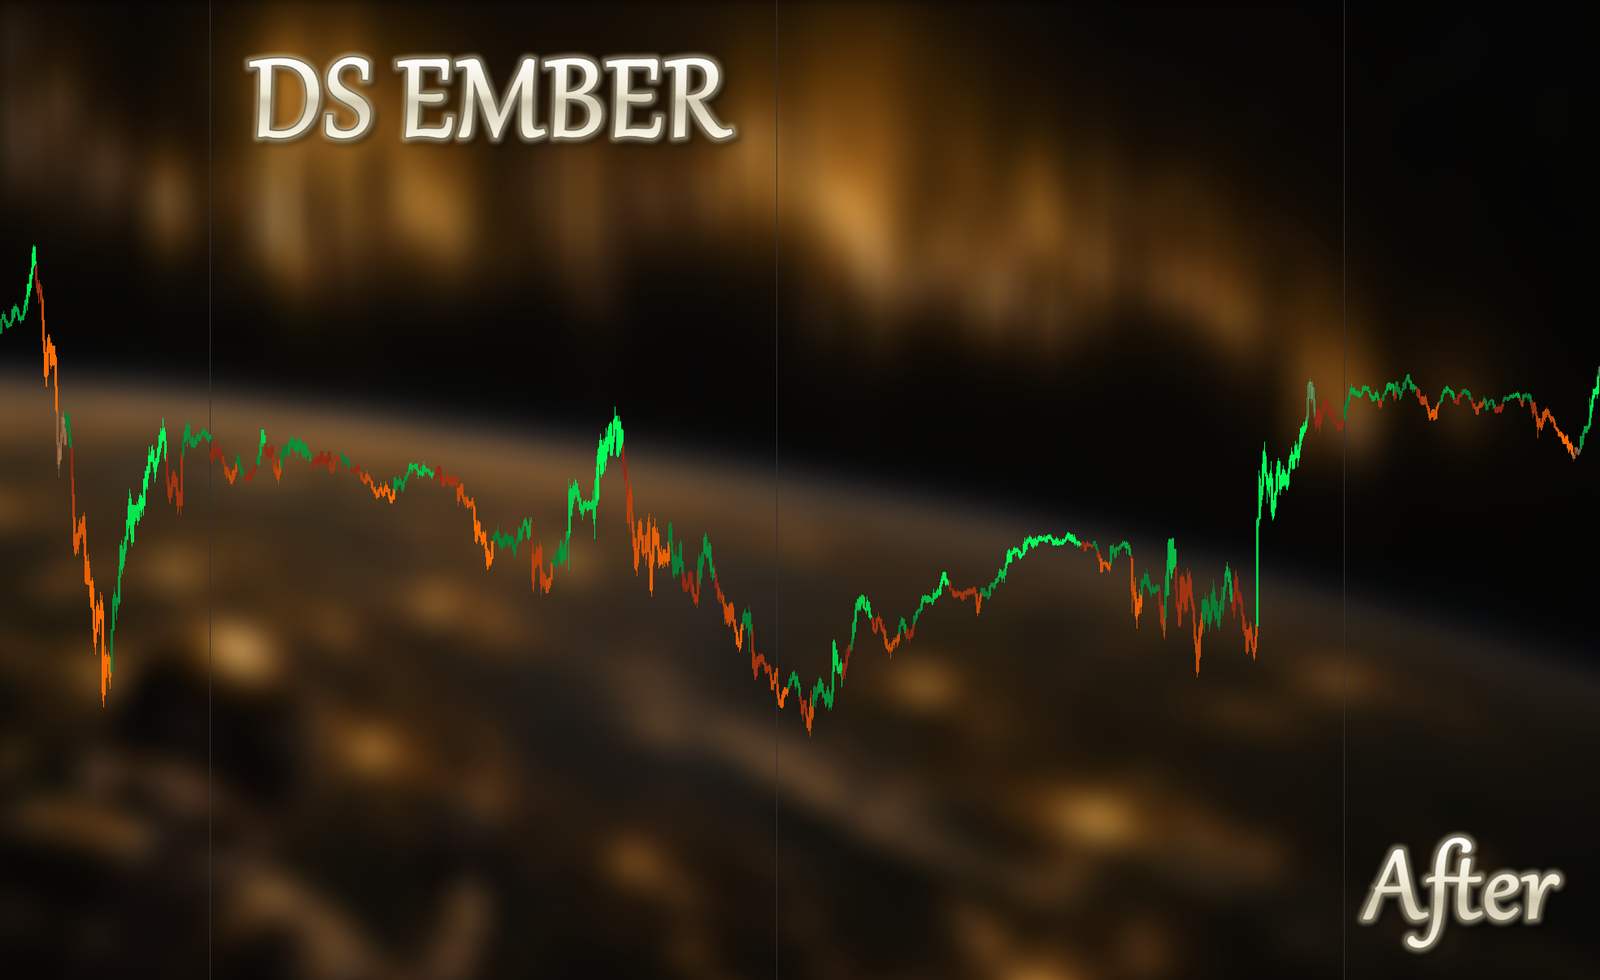
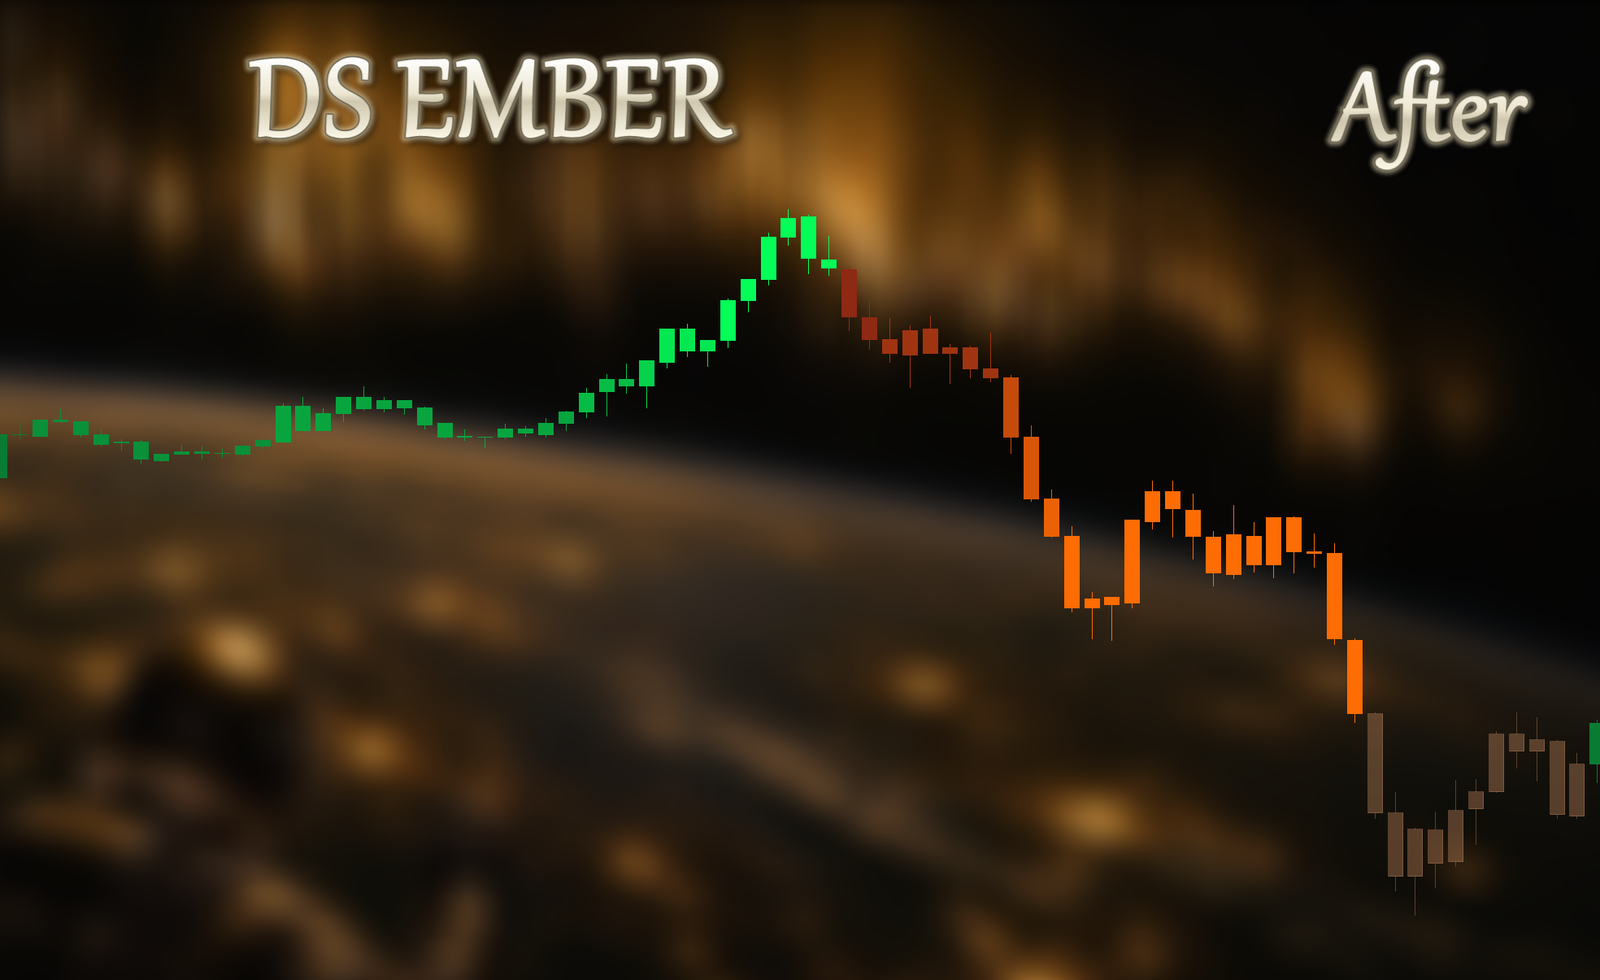
The same chart with DS Ember holding one color per trend and flipping only at the real turn.
After

One trend, one color.

Raw candles flip on every wiggle — a red bar inside a clean uptrend looks like trouble it isn't. Ember holds the trend's true color and switches only at the genuine turn, so the direction stays obvious and the top stops faking you out.

A raw candlestick chart before DS Ember.
Before
The same chart after DS Ember re-colors every candle to the trend's health.
After

The same tape, re-read.

Raw candles tell you where price went. Ember tells you the trend's health, its exhaustion, and its turns — made obvious at a glance, before the move shows its hand.

The MTF Engine

DS Council — three minds, one verdict.

Three AI voters read the market across five timeframes and have to agree before the system says a word. Atlas anchors the trend, Sage weighs the evidence, Nova catches the turn early — a two-of-three majority on each timeframe, or you see nothing.

DS Council
1m5m10m15m60mATLASSAGENOVACOUNCIL

Five timeframes, three voters. Each frame needs a two-of-three majority — green across the grid is your green light.

Atlas

The Anchor
Trend · Timeframe · Structure

Atlas holds the weight of the larger chart — dominant structure and prevailing order flow. He doesn't change his mind without a real reason: the steady hand while the lower frames thrash.

Keeps you on the side the market actually plays. When Atlas votes, you know where the weight of the chart is leaning — so you stop fading moves that have real structure behind them.

Sage

The Judge
Momentum · Confluence

Sage weighs evidence instead of reacting to it. Calm, deliberate, hard to spook — the voice asking whether a move has genuine confluence or is just noise, sitting between macro intent and live momentum.

Filters the chop. Sage is often the deciding vote — the one that turns two disagreeing extremes into a single, clear call.

Nova

The Spark
Momentum · Instinct

Nova is fast and curious — first to feel a shift in momentum, first to call a turn forming. Sharp early, and the first to admit she can be too quick on her own.

Gets you there early. Because she only counts when Atlas or Sage agrees, you get her speed without the false starts.

DS Systems · VWAP Dealing Range

DS Balance

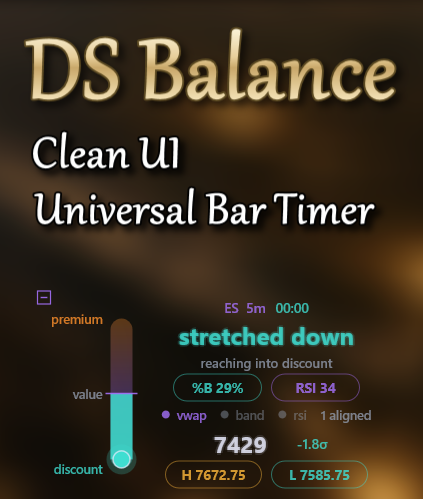
Price spends most of the session rotating around value. DS Balance reads that rotation in one glance — cheap, fair, or expensive — and points to the side the edge sits on. One runway, one price moving through it, every field in agreement.

The DS Balance panel — premium / value / discount runway with %B, RSI and VWAP all aligned on one read.

The % is where price sits inside the Bollinger Band — 100% pinned to the upper band, 0% at the lower band, 50% in the middle. A position in the band, not an amount of premium or discount.

Upper Runway

Premium

Price is expensive

87.83%RSI 71.8

Price has climbed near the ceiling, far above the midpoint, and RSI is overbought (above 70). The − flags the sell-side edge — the engine watches for reversion back toward value.

What it does for you

Stops you chasing longs into a stretched tape. This is where you hunt shorts back toward value off the orange ceiling.
Mid Runway

Equilibrium

Price is at fair value

49.00%+RSI 49.4

Price sits dead center of the runway with RSI neutral. There's no stretch to trade against in either direction.

What it does for you

The stand-aside read. Reversion pays poorly from the middle, so this saves you from forcing trades in the dead zone — wait for an edge.

Lower Runway

Discount

Price is cheap

22.00%+RSI 27.4

Price has dropped near the floor, well below the midpoint, and RSI is oversold (below 30). The + flags the buy-side edge — reversion back up toward value.

What it does for you

Your buy-the-dip read. You look for longs back toward value off the teal floor, on BOS confirmation rather than catching the knife.

One read that always agrees with itself

Because the percentage, zone, sign and RSI all come off the same VWAP ±σ runway, they can't contradict each other — you'll never see a Premium label paired with a buy bias. Buy the discount, sell the premium, stand aside at equilibrium. The single orange glow dot prints only where the Bollinger Band and RSI line up on the same candle — price stretched to the band's edge at the moment momentum turns. Location and timing confirm each other on one mark, so you're reading the turn instead of guessing it or catching a falling knife.

Why DS Universe

A clean chart that earns its ink.

Accuracy you can lean on, speed you never feel, and a chart that gets out of the way the second you need it to.

Built for every timeframe

Every metric is tuned and normalised to read any timeframe — the same corroborated read from the 1-minute scalp to the daily swing, not lone guesses.

Cross-referenced by the Registry

Five of the six Systems report to one core. Every reading is checked against every other before a single mark is drawn. The systems agree, or you see nothing.

Zero repaints

What you saw is what happened. Signals lock to the bar and never rewrite history — the chart you trade is the chart that was true.

No lag, ever

Heavy intelligence that never drags your chart. Every read is cross-referenced and rendered instantly, so the tape stays smooth even mid-session.

How it works

From feed to conviction in three steps.

01

Install

Our packaging DLL handles the install. DS Carepack, DS Crewmates and DS Radars load onto NinjaTrader 8 as regular indicators; the DS Systems get the DS Registry add-on wired in first, automatically — so the suite is bound before your first chart.

02

Load the read

Pilots, Sweeper and Beacon light up the tape; Orbit, Stars, Balance, Ember and Council map the field on the DS Registry core — while DS Pulse reads raw order flow as the standalone, no Registry required.

03

Trade with precision

Take the read when the systems align, flip the panels away to lock in on pure price. Your call, instantly.

DS P&L · Performance Intelligence

Your trades. One clear read.

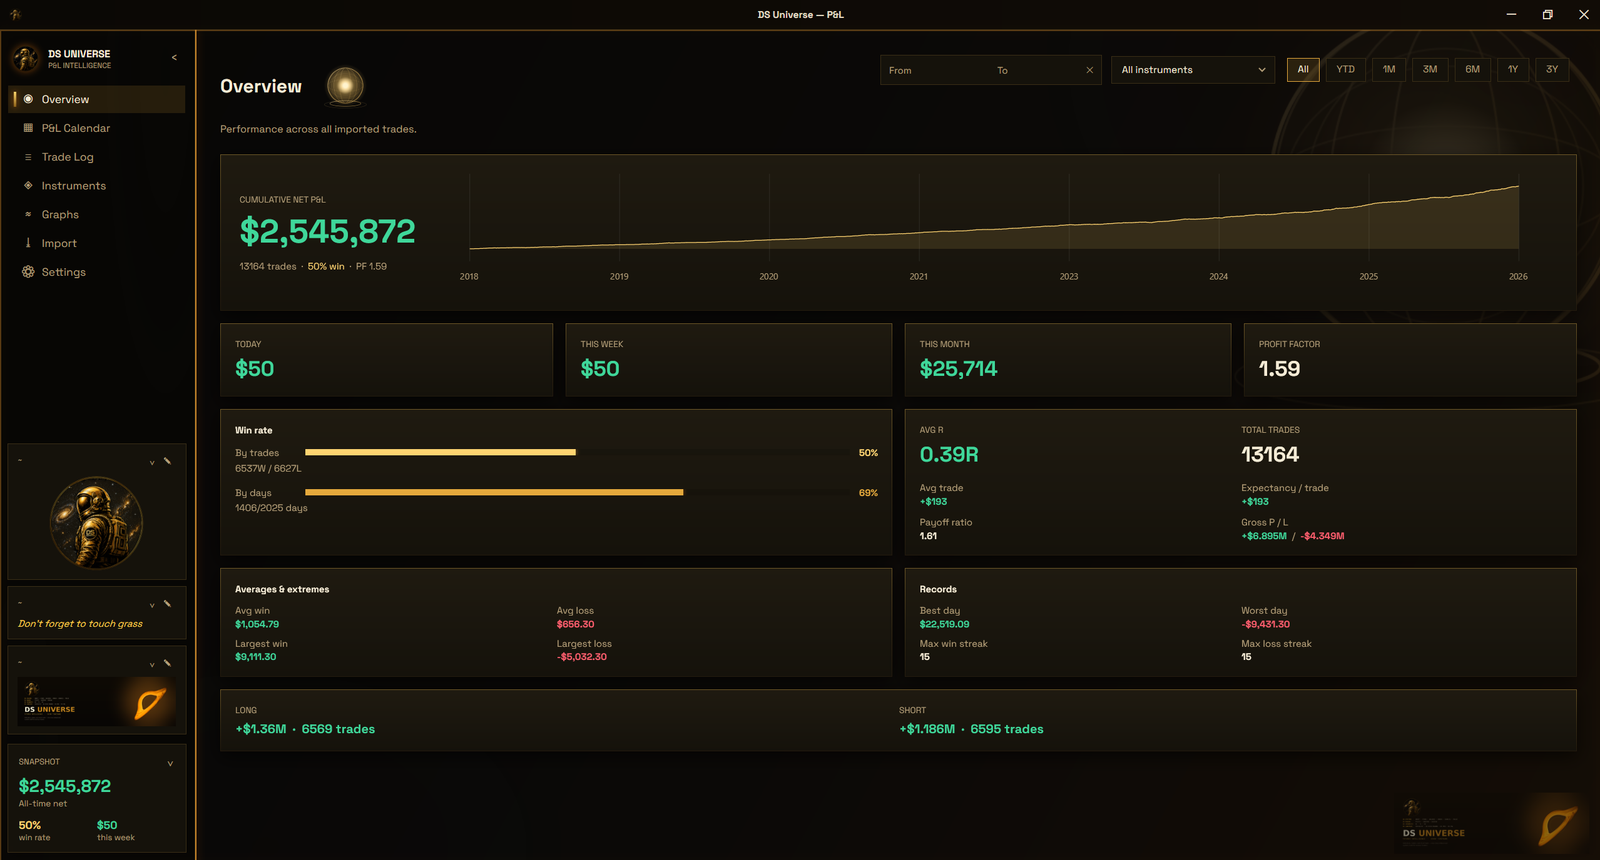
DS P&L — The overview
The overview
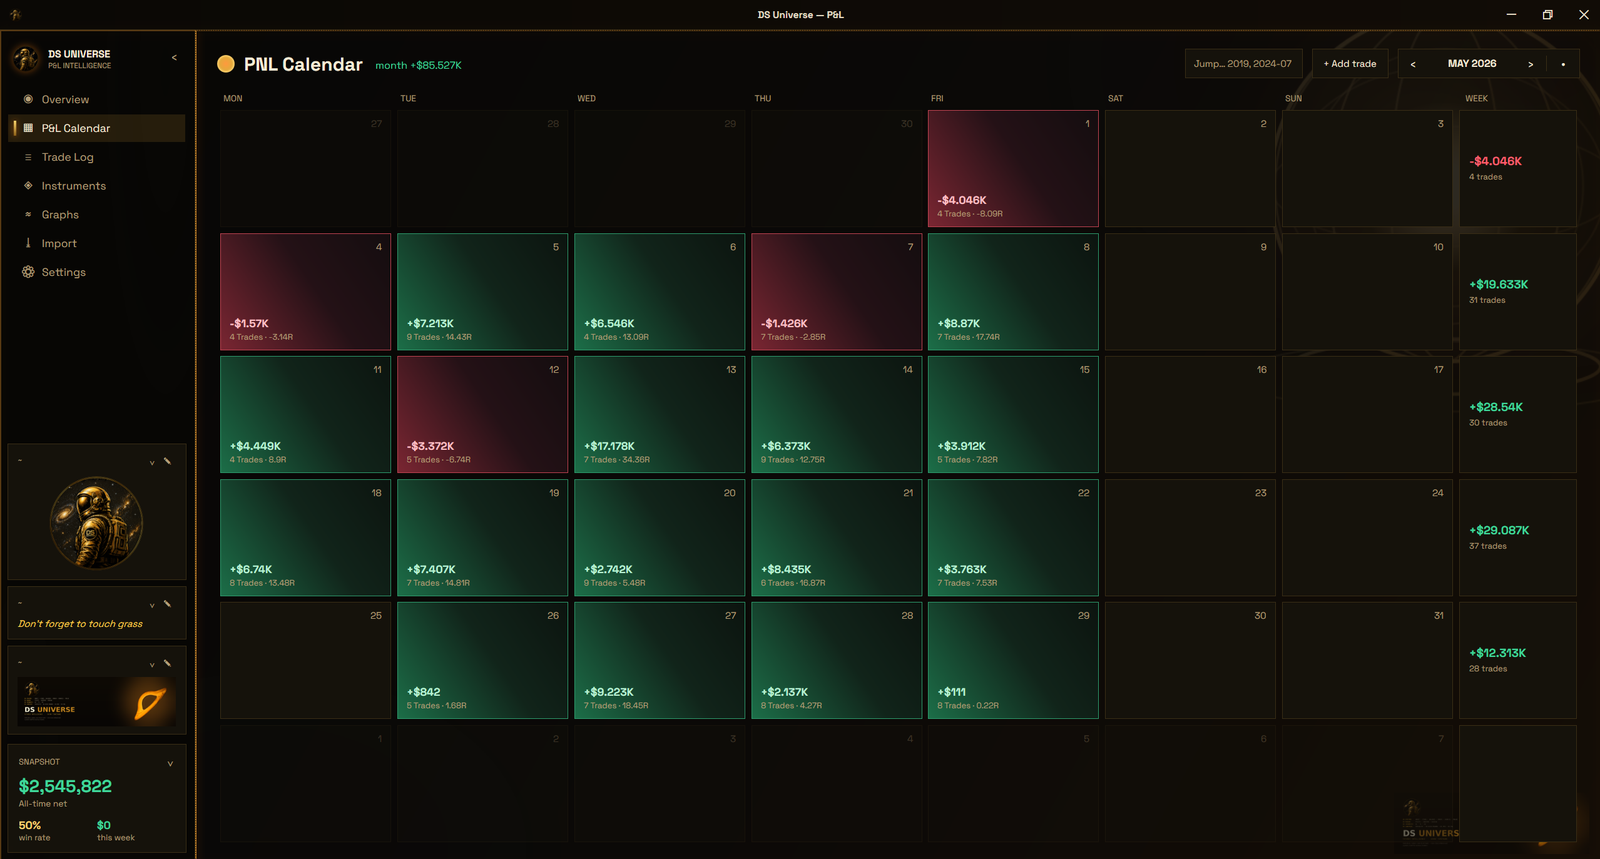
DS P&L — The P&L calendar
The P&L calendar

DS P&L turns a single NinjaTrader export into your own trading, made legible — cumulative P&L, your win/loss balance, streaks and per-instrument breakdowns, with a day-by-day calendar. One file in and you see what's working, what's leaking, and where your edge really lives. No spreadsheets, no formulas, and nothing leaves your machine.