DS ASL
Session Levels & Volume Profile
- A volume profile in every session
Not sold on its own
Free with DS CompleteGet DS Complete — DS ASL, opens Whop in a new tab
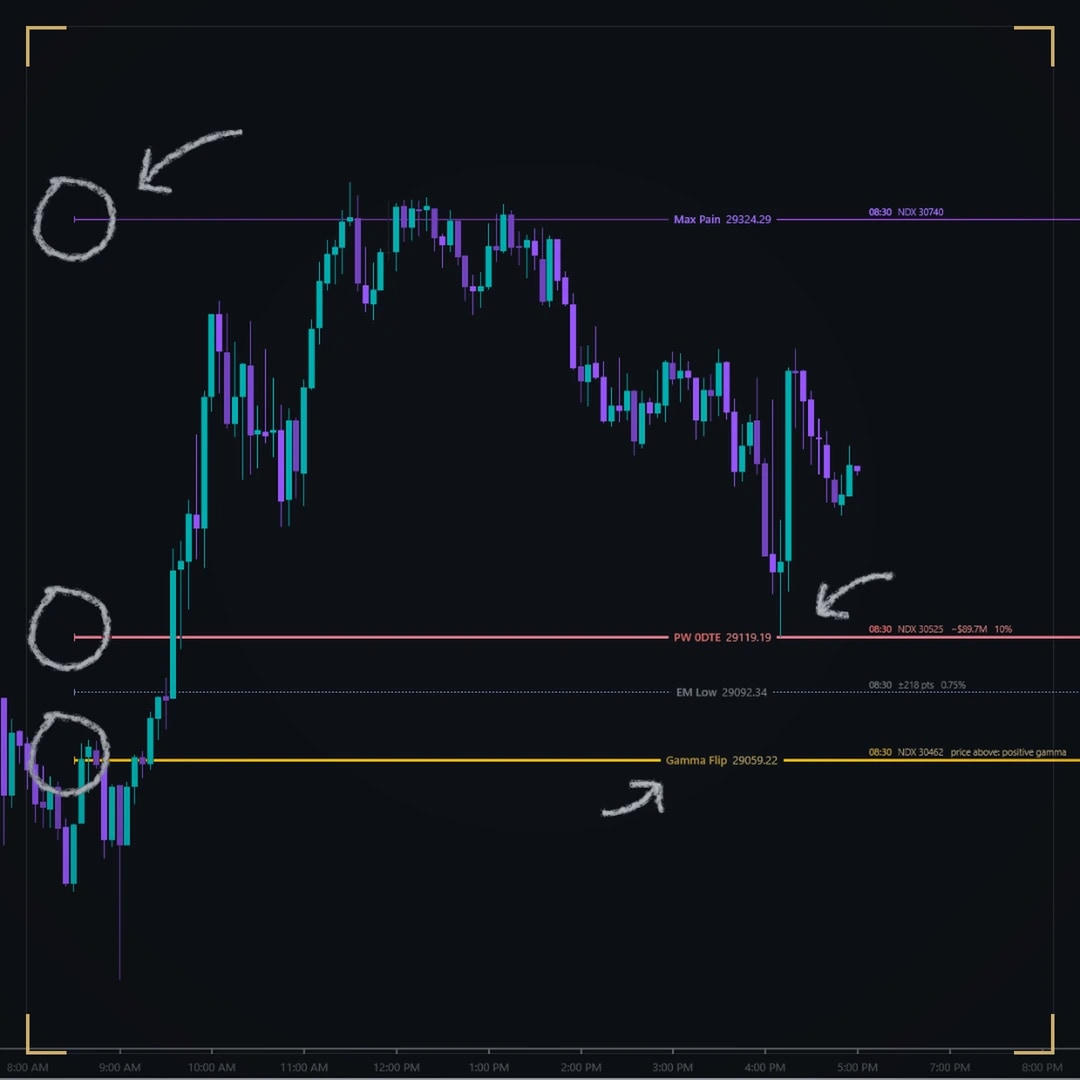
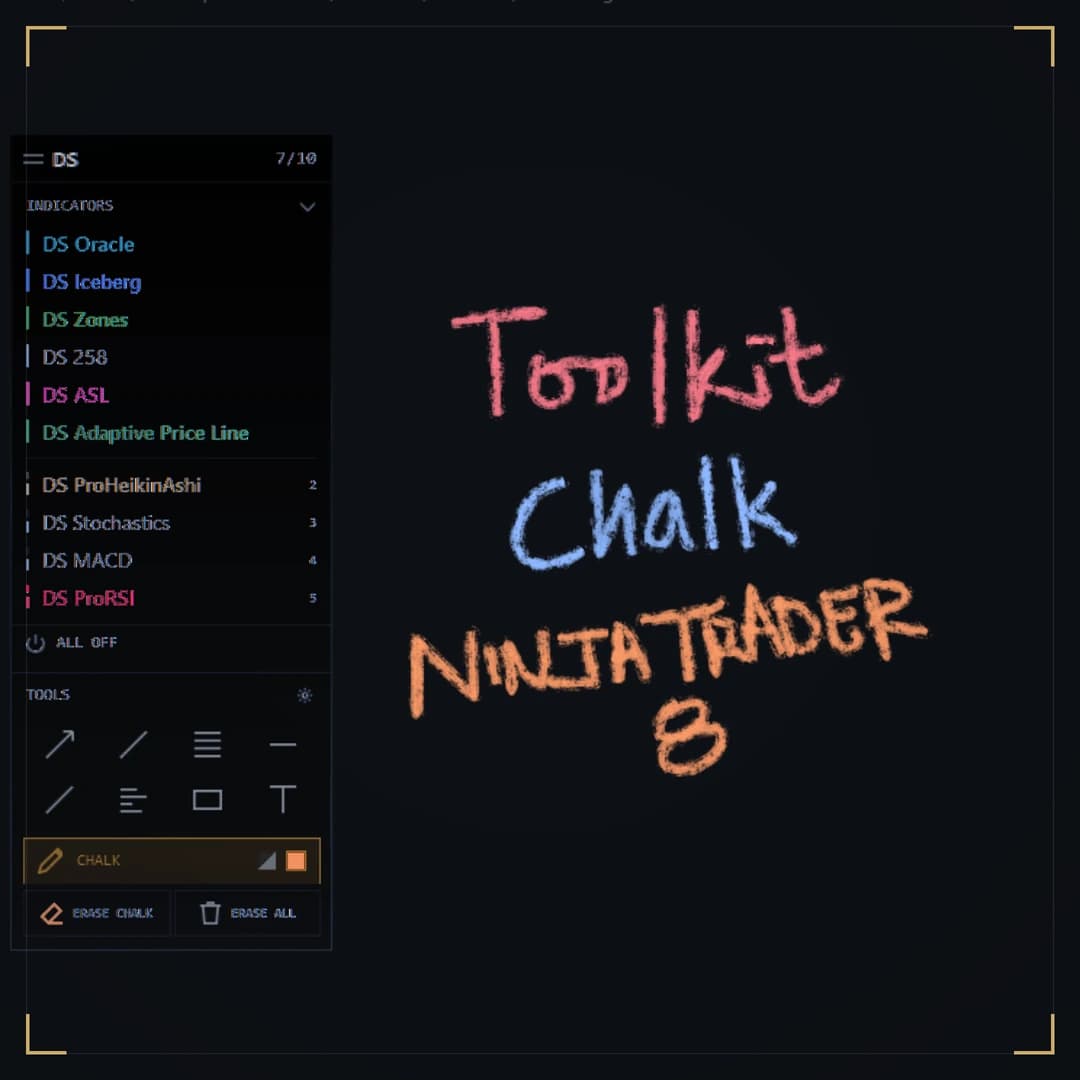
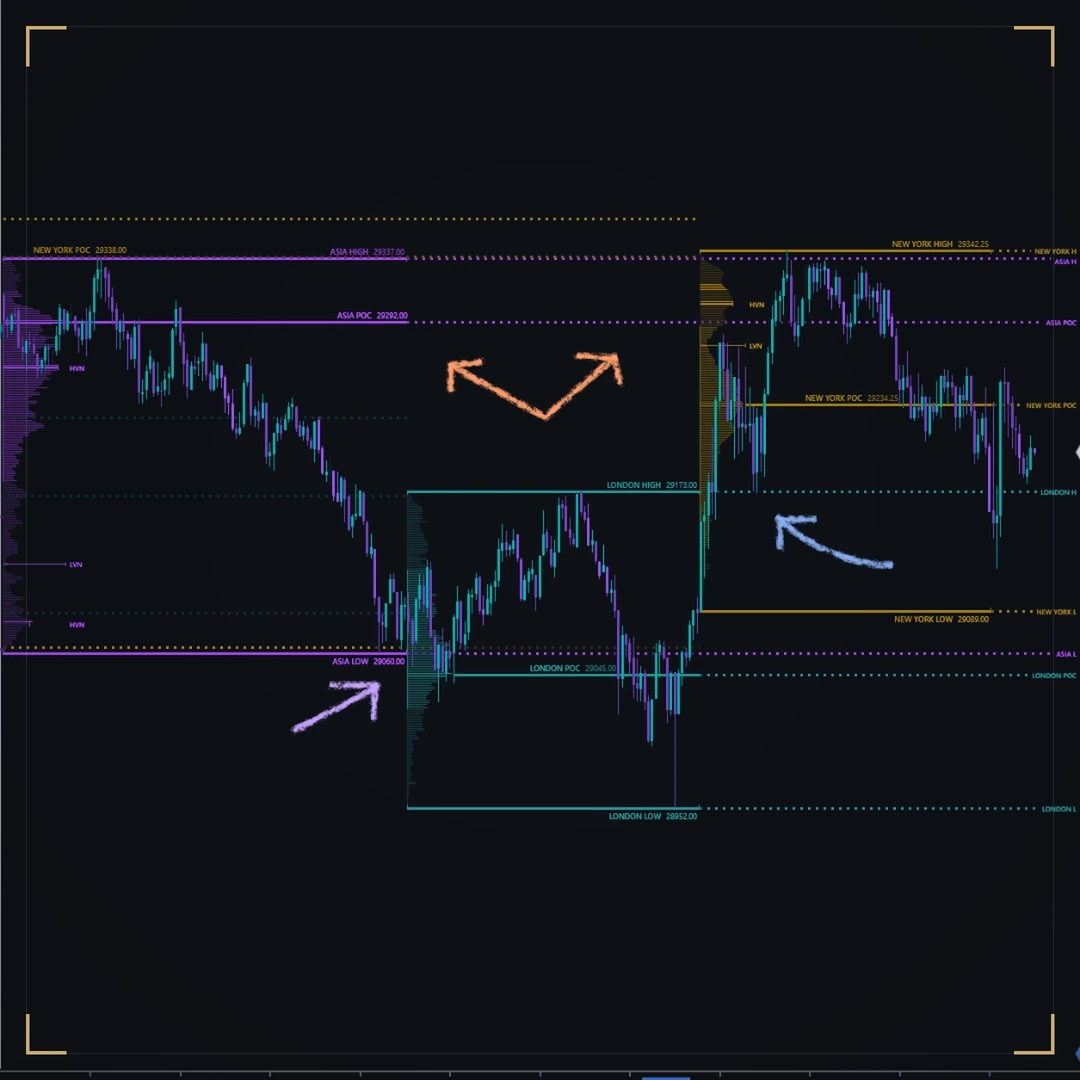
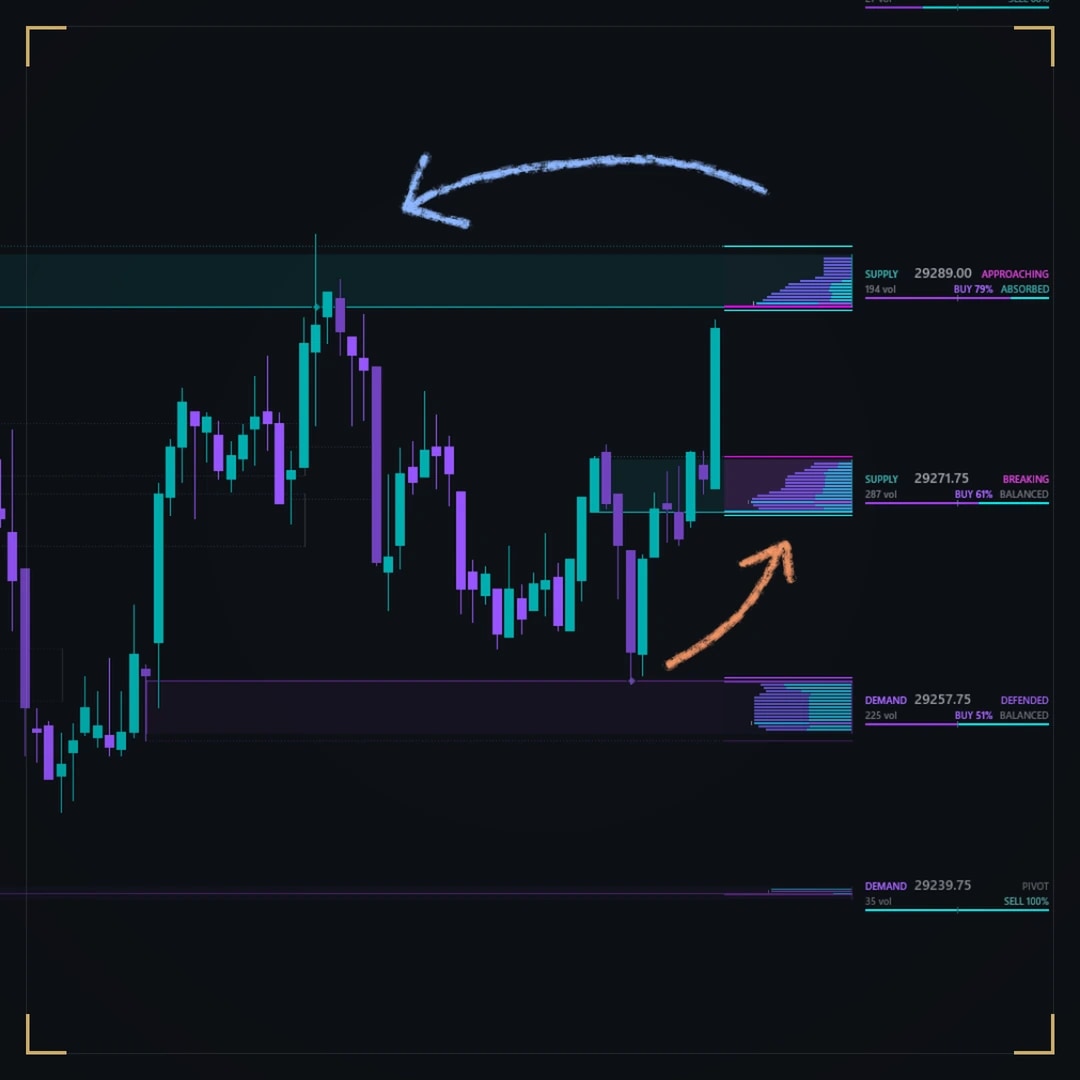
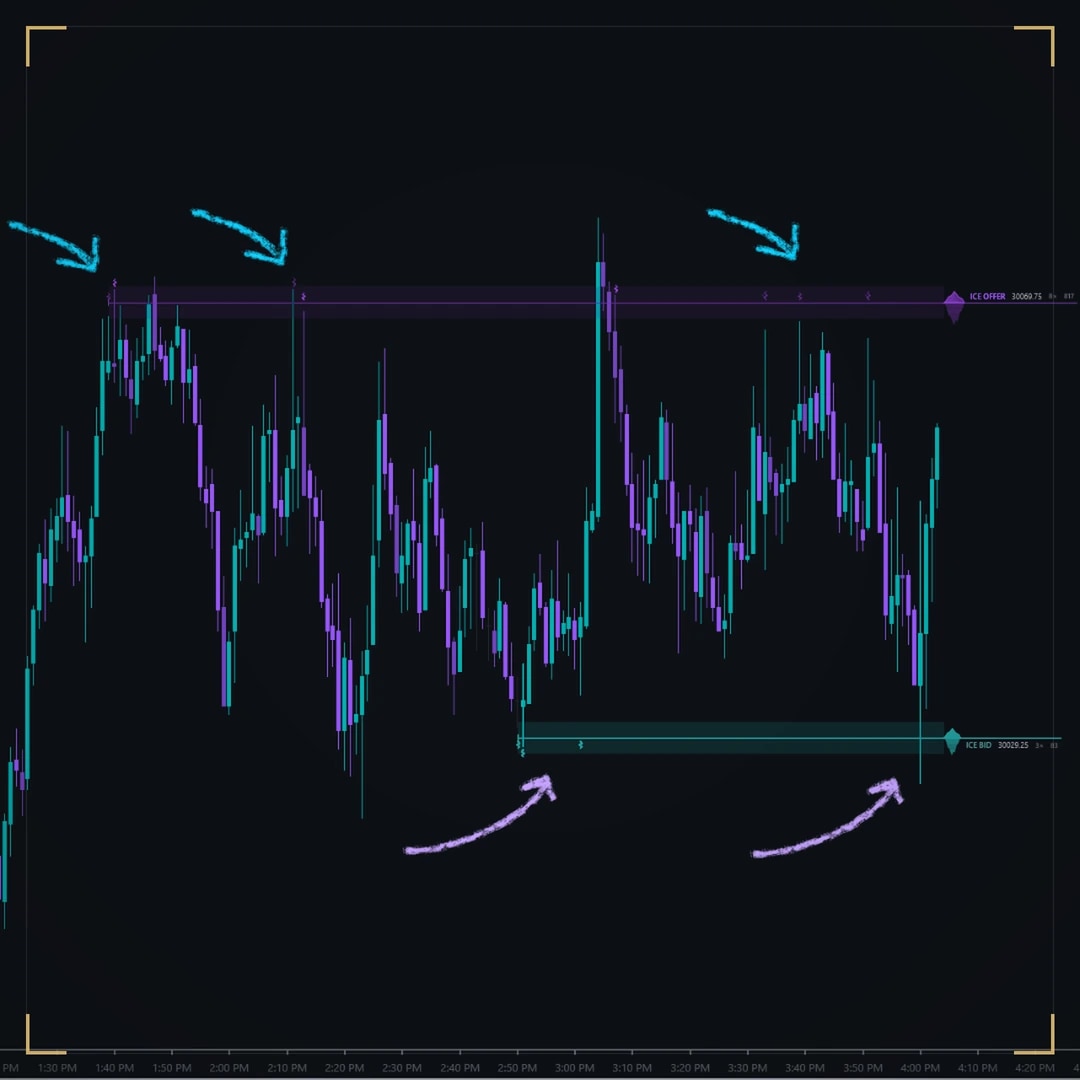
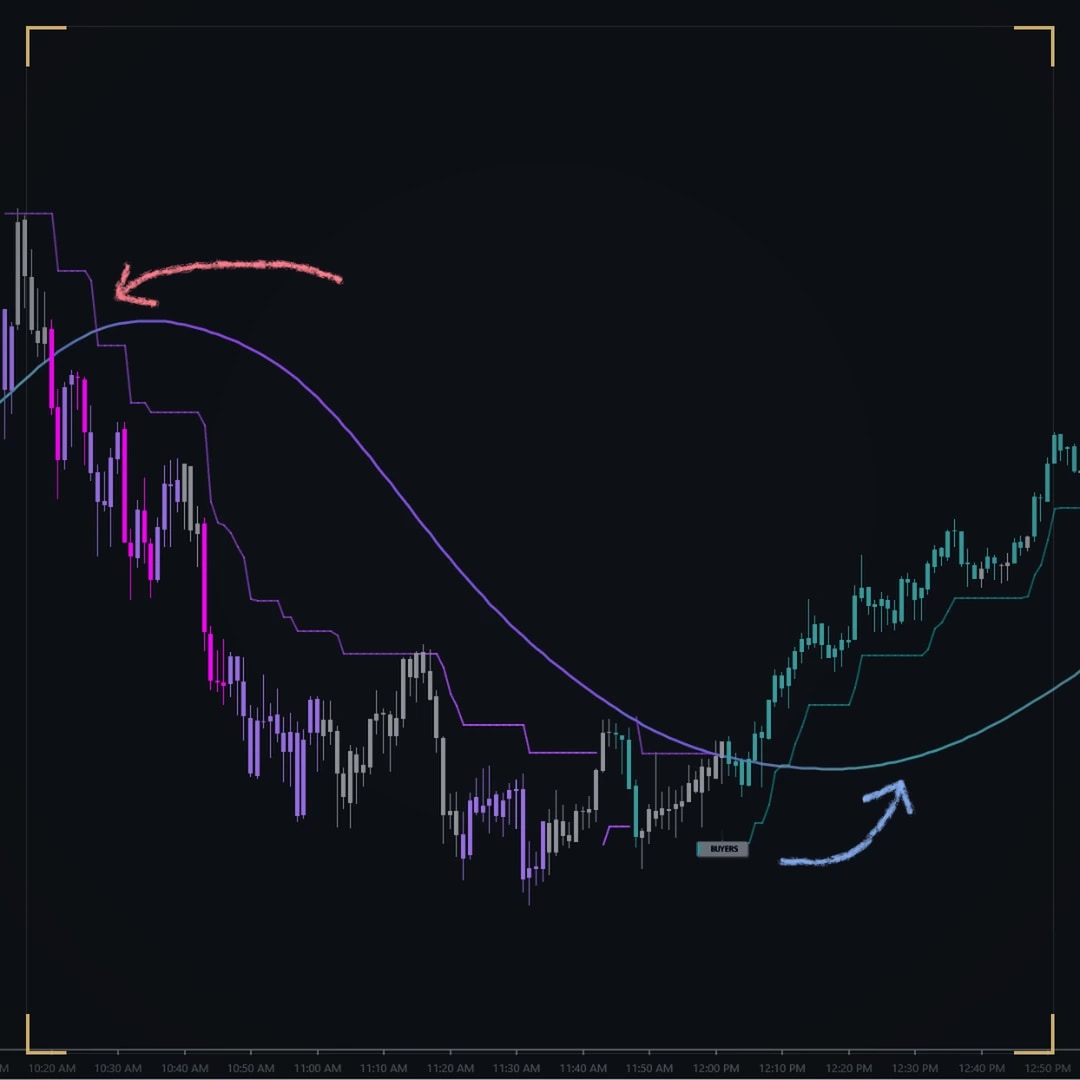
The rail at 6/13: DS Iceberg, Zones, ASL, Adaptive Price Line, Chart Price and ProLiquidityHunter switched on, the drawing tools below, and chalk notes over price.
Chart pictures are illustrations of the software, not a performance record. Futures trading carries substantial risk of loss and is not suitable for every investor, and hypothetical or simulated results have inherent limitations that may differ materially from live trading. Risk disclosures.
Why you need it
Turning an indicator off usually means the Indicators dialog, a checkbox and Apply; finding the drawing tool you use forty times a day means hunting the toolbar. DS Toolkit puts both in one translucent rail: your DS indicators along the top as simple on/off rows, your drawing tools underneath, and freehand chalk at the bottom — so neither one breaks your rhythm mid-session.
What the rail does
Turning an indicator off usually means a dialog, a checkbox and Apply. Here it is one click.
Before you buy
Where it runs
Any chart
It works the chart, not the market: the rail lists whichever DS indicators are on that chart.
What it reads
No market data. It reads which DS indicators and drawing tools are on the chart.
NinjaTrader 8 · 8.1.8.1 or newer. Everything runs on your machine, on your own data feed.
Good to know
Every drawing tool on your build appears for free, plus DS Chalk — a real drawing tool whose strokes pan, zoom and save with the workspace.
It comes free with DS Complete and is not sold on its own.
DS Universe tools are charting and research software for educational and informational purposes. They are not investment advice and no output is a forecast or a guarantee of any result. Trading futures and other leveraged instruments carries substantial risk of loss and is not suitable for every investor.

Four screenshots and a paragraph are not enough to judge an indicator on. Watch it work in your own instrument, on your own timeframe, before it goes anywhere near a live account. Both ways of doing that are free.
Market Replay runs a past session back tick by tick, at whatever speed you like. You get to watch DS Toolkit print in conditions you remember, and pause on the bars where it mattered.
Replay shows you the past with the ending already known. The simulator does not — it runs live, in real time, on real prices, with nothing at stake. That is where you find out whether you can actually act on what you are seeing.
A simulated fill is not a live fill. Replay and the simulator cannot reproduce real queue position, slippage, or what it feels like to hold a position with money on it, and results from either may differ materially from live trading. Test to learn how a tool behaves — not to estimate what it might return.
In motion
Recording · 20 sChalk on a chart running the DS tools: an oval, a circle and arrows drawn freehand over price, then erased.
The recording and chart pictures above show the software running; they are not a performance record. Futures trading carries substantial risk of loss and is not suitable for every investor, and hypothetical or simulated results have inherent limitations that may differ materially from live trading. Risk disclosures.
Also in the bundle
Session Levels & Volume Profile
Not sold on its own
Structure & Levels
Liquidity & Absorption
AI Trend & Signals
3-day free trial