DS Adaptive Price Line
Chart Essentials
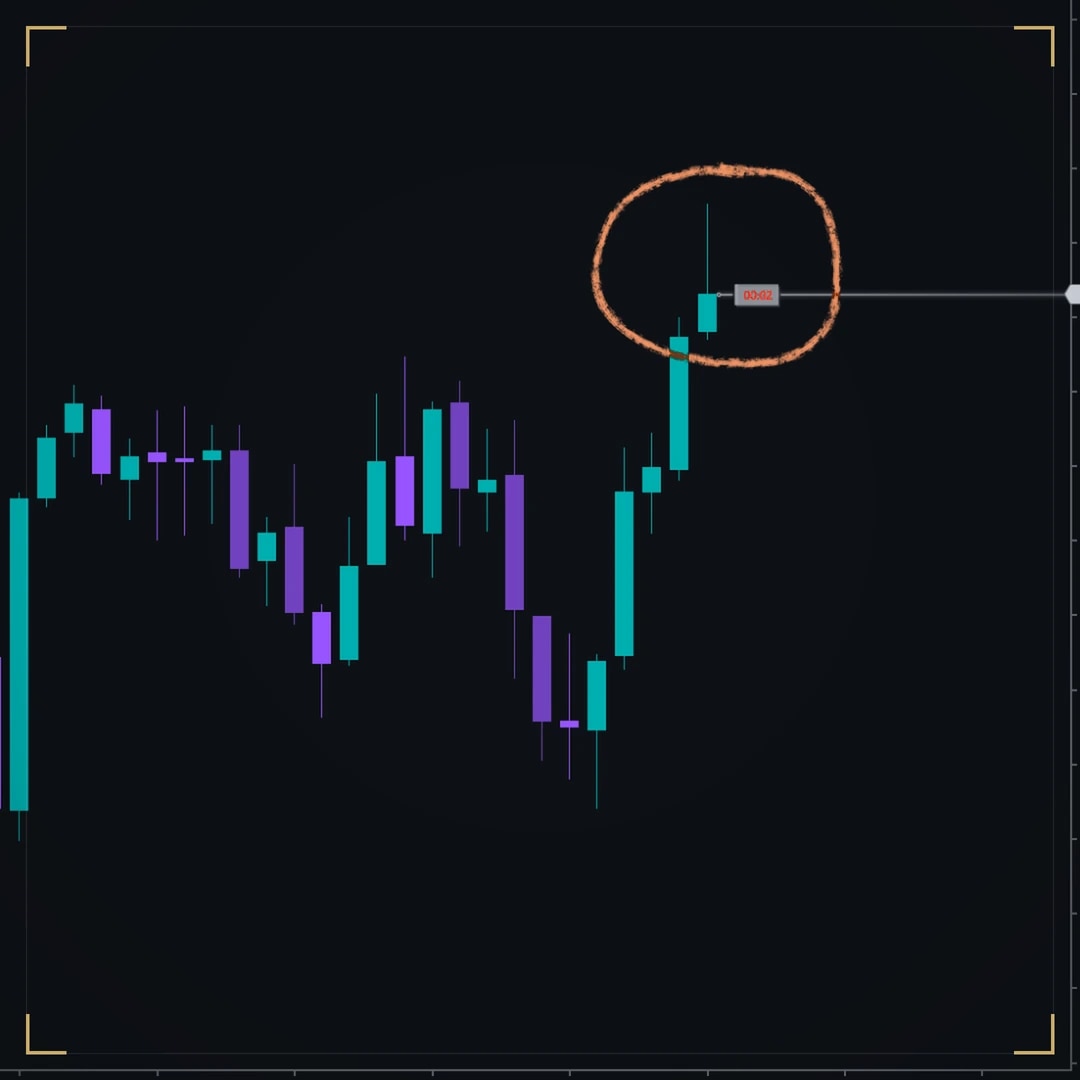
- Always anchored to the candle
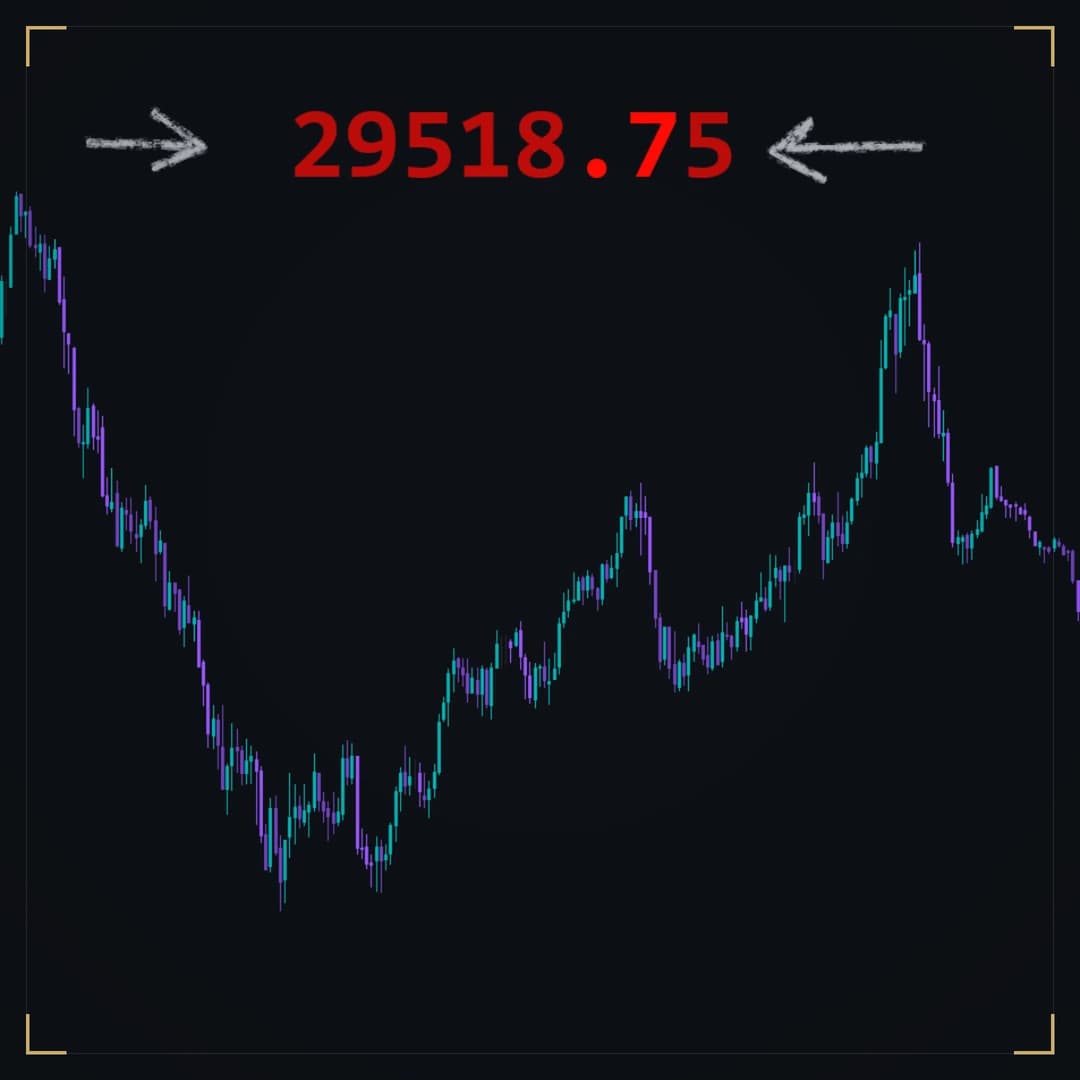
Mono: the last price, 29145.50, large and gray at the top center of a dark chart.
Chart pictures are illustrations of the software, not a performance record. Futures trading carries substantial risk of loss and is not suitable for every investor, and hypothetical or simulated results have inherent limitations that may differ materially from live trading. Risk disclosures.
Why you need it
On a NinjaTrader chart, price lives in one place: the axis, in small type, at the far right. DS Chart Price puts it front and center instead, in a large readout you can place in any of nine spots on the panel, color-coded so you can read direction and conviction from across the room — and it carries a small price-alert engine with built-in tones so you can step away and still hear when a level you set gets hit.
Built in
Upticks flash green, downticks flash red — and the resting color eases to amber as the tape loses efficiency, so you feel chop before you name it.
Before you buy
Where it runs
Any market NinjaTrader charts
It reads the chart's own last price, tick by tick, so the market makes no difference.
What it reads
The chart's last price, tick by tick. Nothing else.
NinjaTrader 8 · 8.1.8.1 or newer. Everything runs on your machine, on your own data feed.
Good to know
Tick-driven with no forced repaints, so it adds nothing to the chart you already run.
DS Universe tools are charting and research software for educational and informational purposes. They are not investment advice and no output is a forecast or a guarantee of any result. Trading futures and other leveraged instruments carries substantial risk of loss and is not suitable for every investor.

Four screenshots and a paragraph are not enough to judge an indicator on. Watch it work in your own instrument, on your own timeframe, before it goes anywhere near a live account. Both ways of doing that are free.
Market Replay runs a past session back tick by tick, at whatever speed you like. You get to watch DS Chart Price print in conditions you remember, and pause on the bars where it mattered.
Replay shows you the past with the ending already known. The simulator does not — it runs live, in real time, on real prices, with nothing at stake. That is where you find out whether you can actually act on what you are seeing.
A simulated fill is not a live fill. Replay and the simulator cannot reproduce real queue position, slippage, or what it feels like to hold a position with money on it, and results from either may differ materially from live trading. Test to learn how a tool behaves — not to estimate what it might return.
See it work
The conditions DS Chart Price is built for, drawn by its shipped rules. Scroll and scale it like a chart, replay it bar by bar, jump between its moments, or switch the chart to light.
DS Replay examples are illustrative: each scenario is composed for the example from recorded one-minute futures candles, to show the conditions a tool is built for, and is not a recording of a trading session. The tool drawing on it runs its shipped rules unchanged. They show how the software reads price; they are not a performance record, no trade is taken or shown, and live markets often behave differently. Futures trading carries substantial risk of loss and is not suitable for every investor, and hypothetical or simulated results have inherent limitations that may differ materially from live trading. Risk disclosures.
More in the vault
Chart Essentials
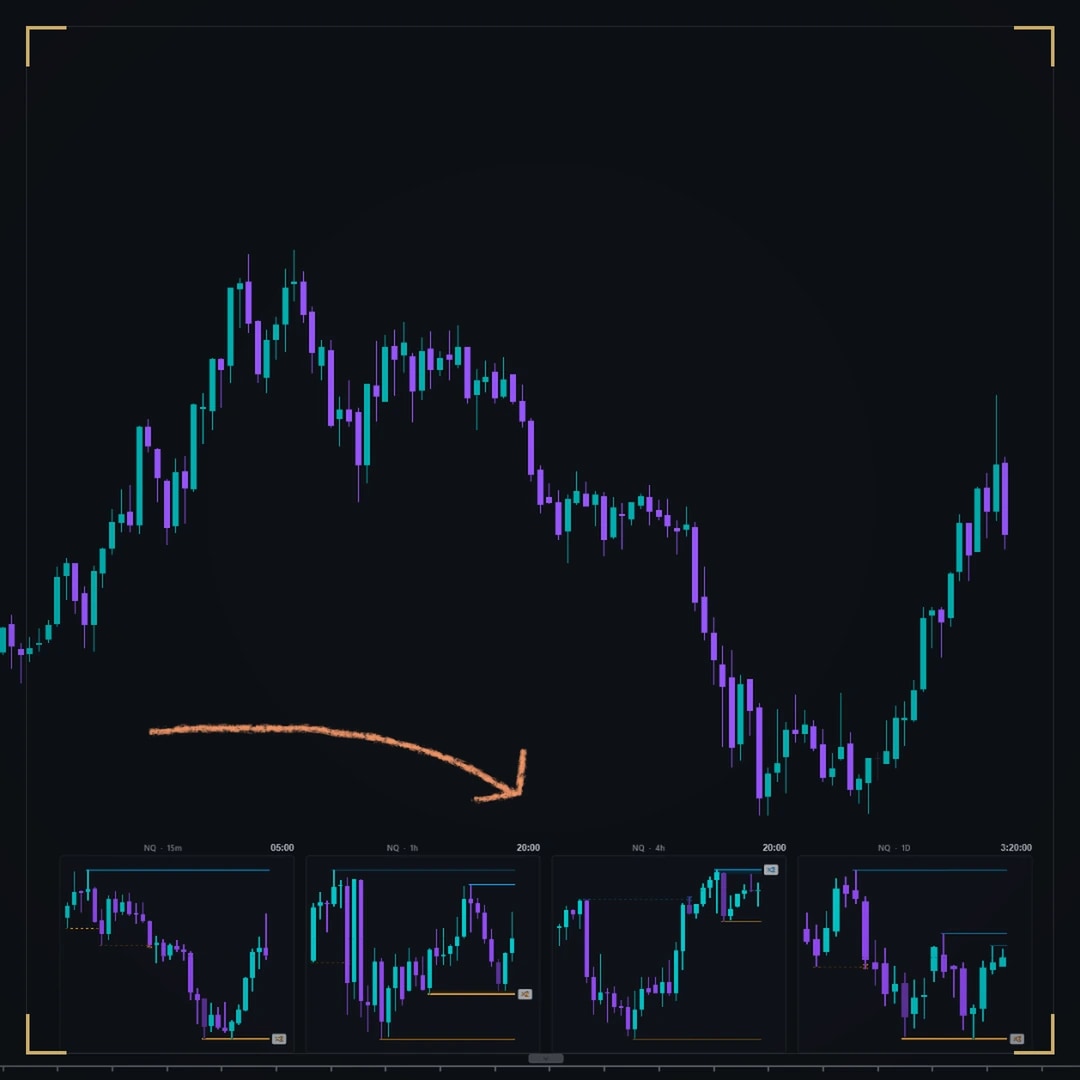
Multi-Timeframe Liquidity
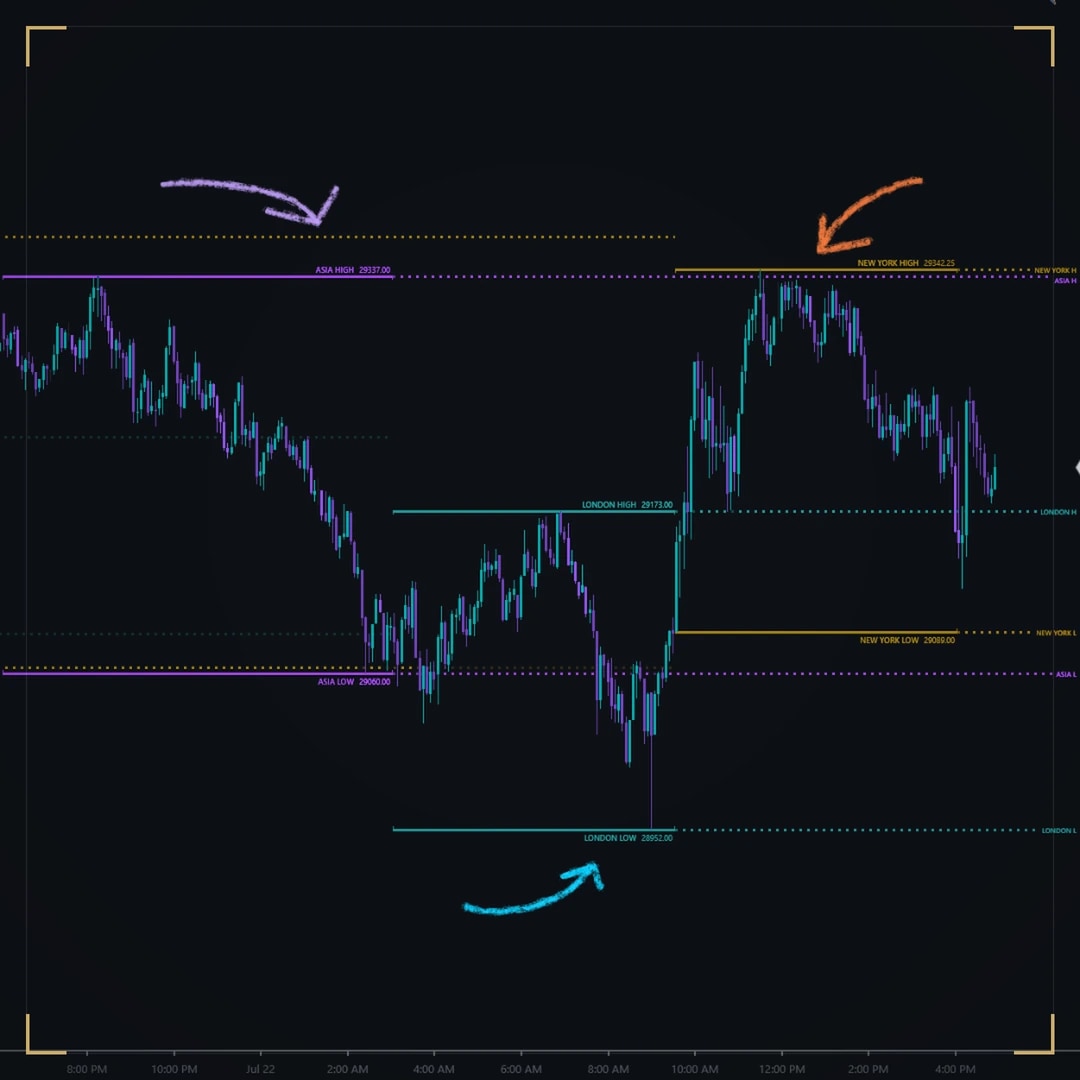
Session Levels